Working Paper - Employment Concentration and its Effect on American Cities
Before this project, I assumed cities with robust public rail systems would have lower rents, believing more transit options would expand living spaces within commuting distance of jobs. I didn’t realize I was assuming jobs would be concentrated in city centers, specifically central business districts (CBDs). While this holds for New York, it doesn’t for Los Angeles. This led me to explore:
- Which cities have the most centralized job centers?
- How does the size of a city’s job center affect home values, rents, and income levels?
- Does employment density influence income segregation?
Initially, I used CPI rent and home value data, but I switched to the American Community Survey (ACS) for its locality-specific attributes. With the Tidycensus library in R, I can retrieve ACS data much faster than BLS data.
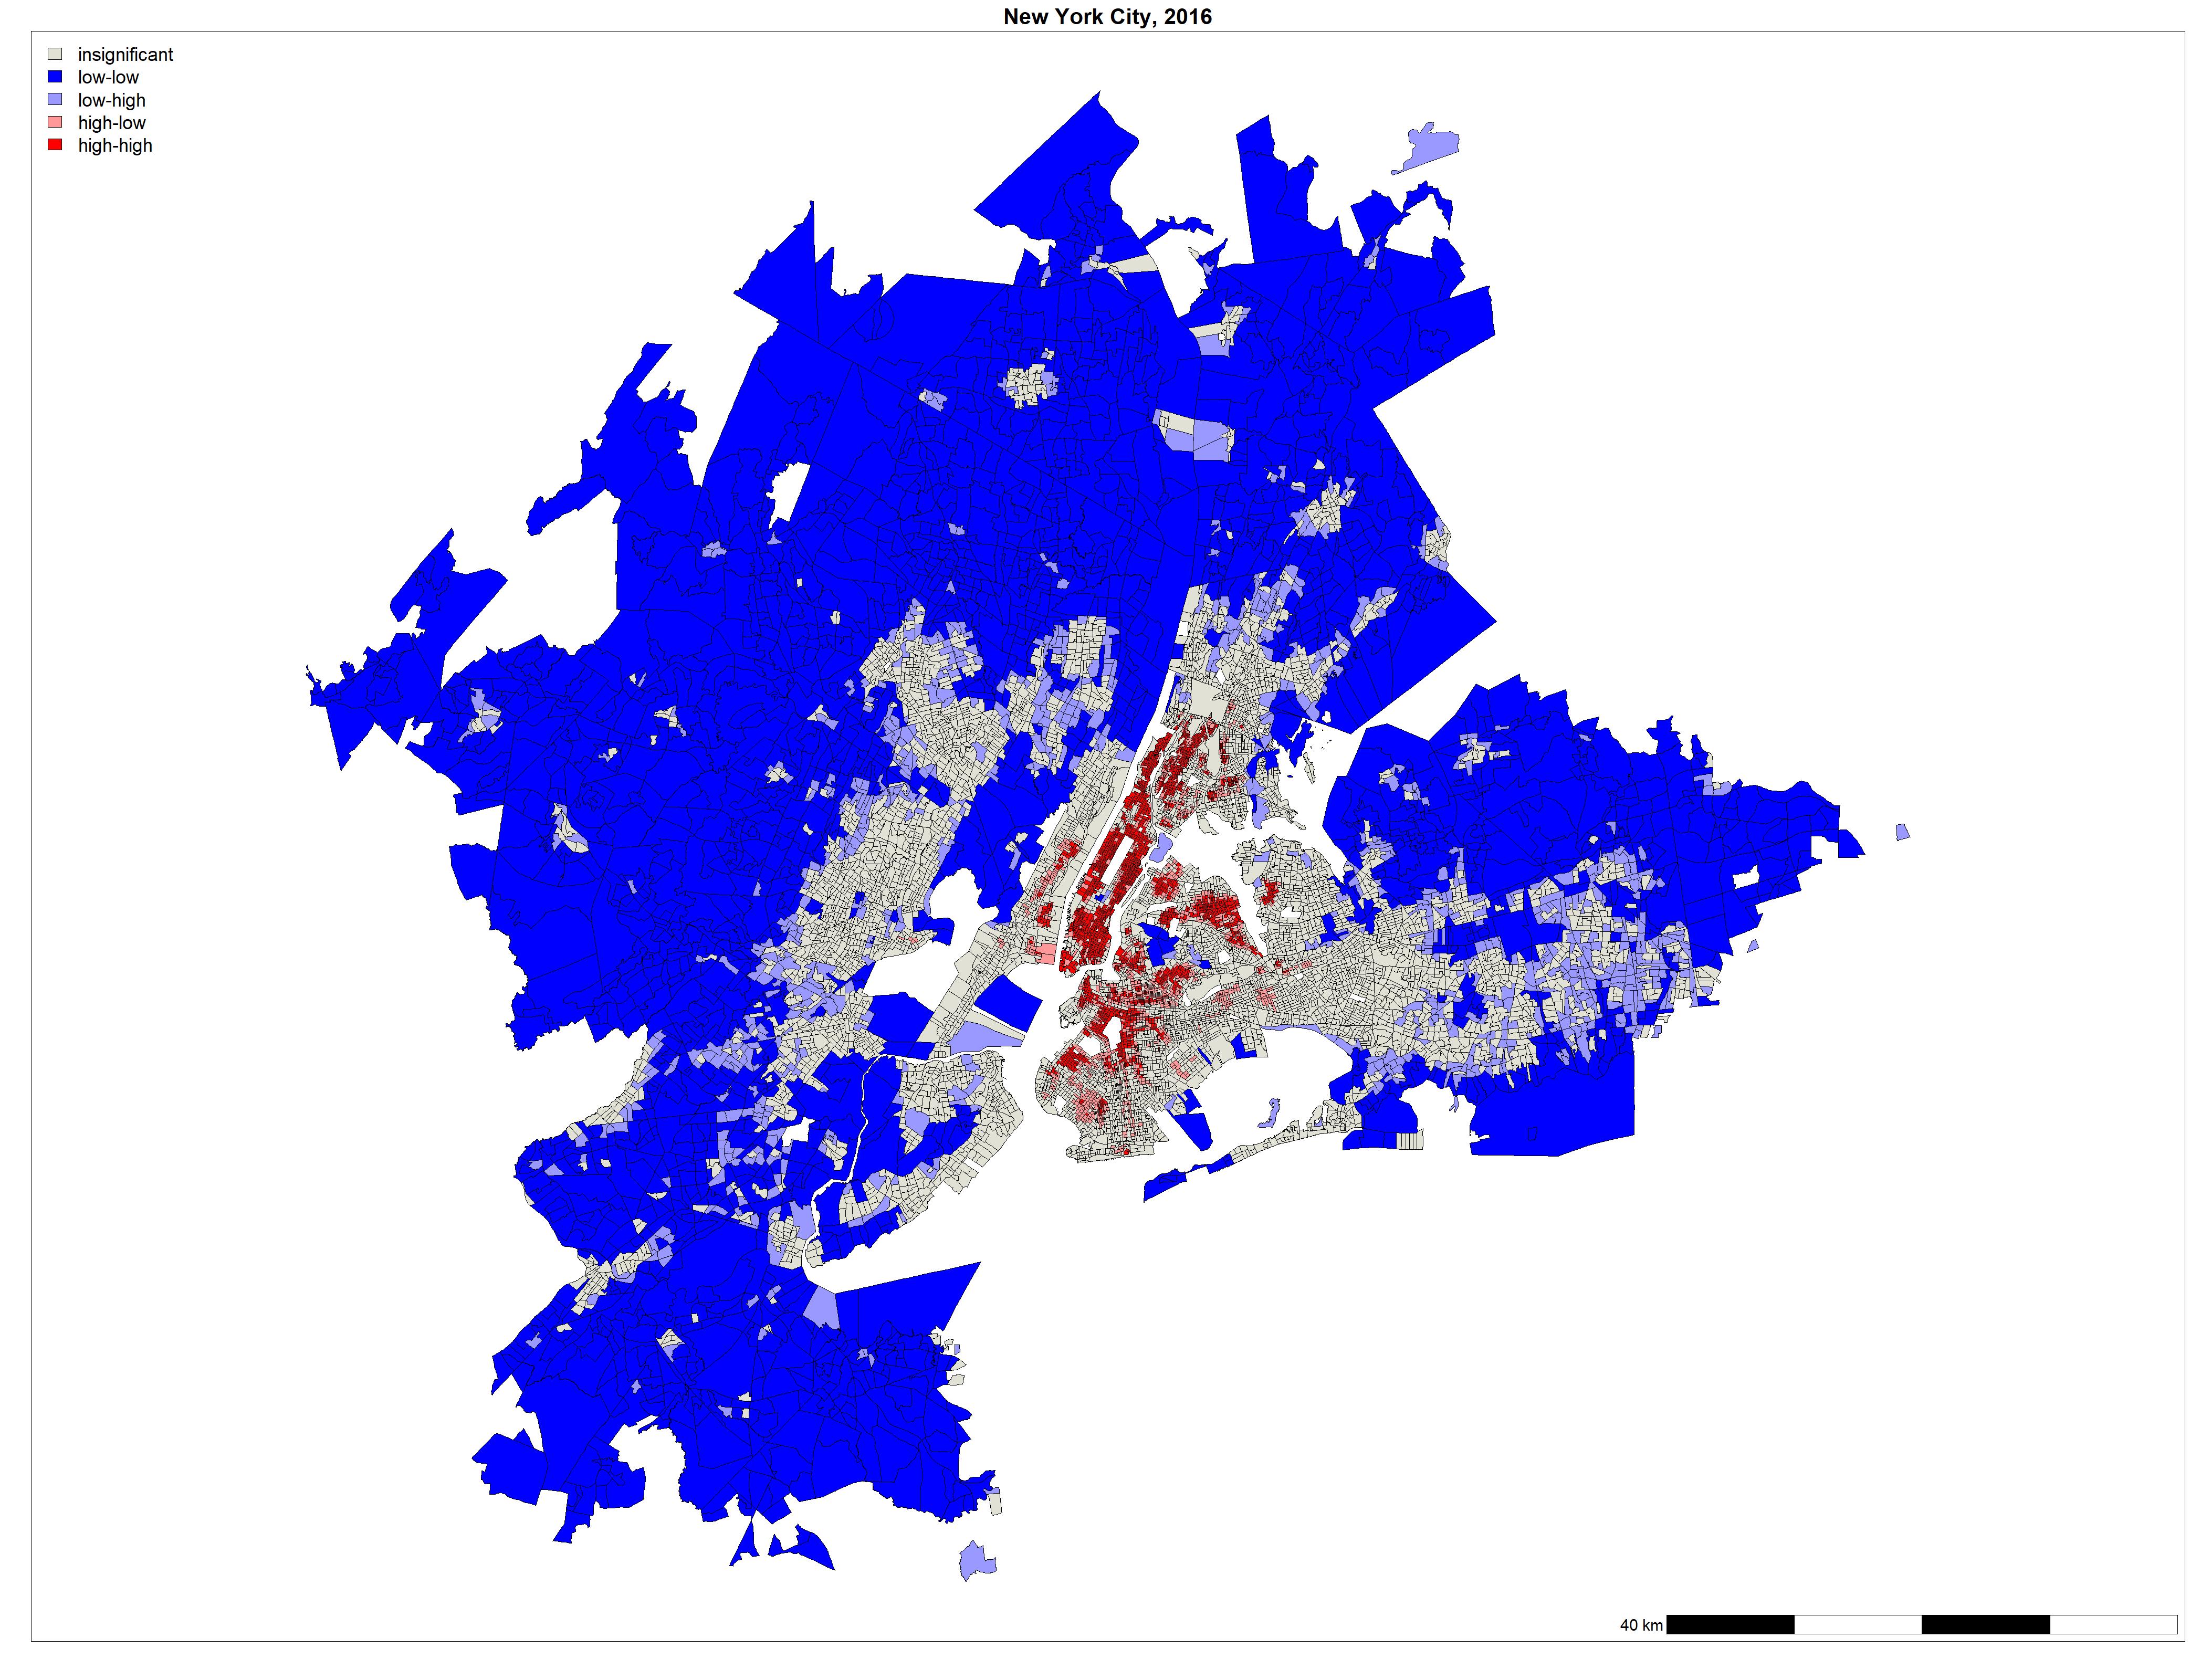
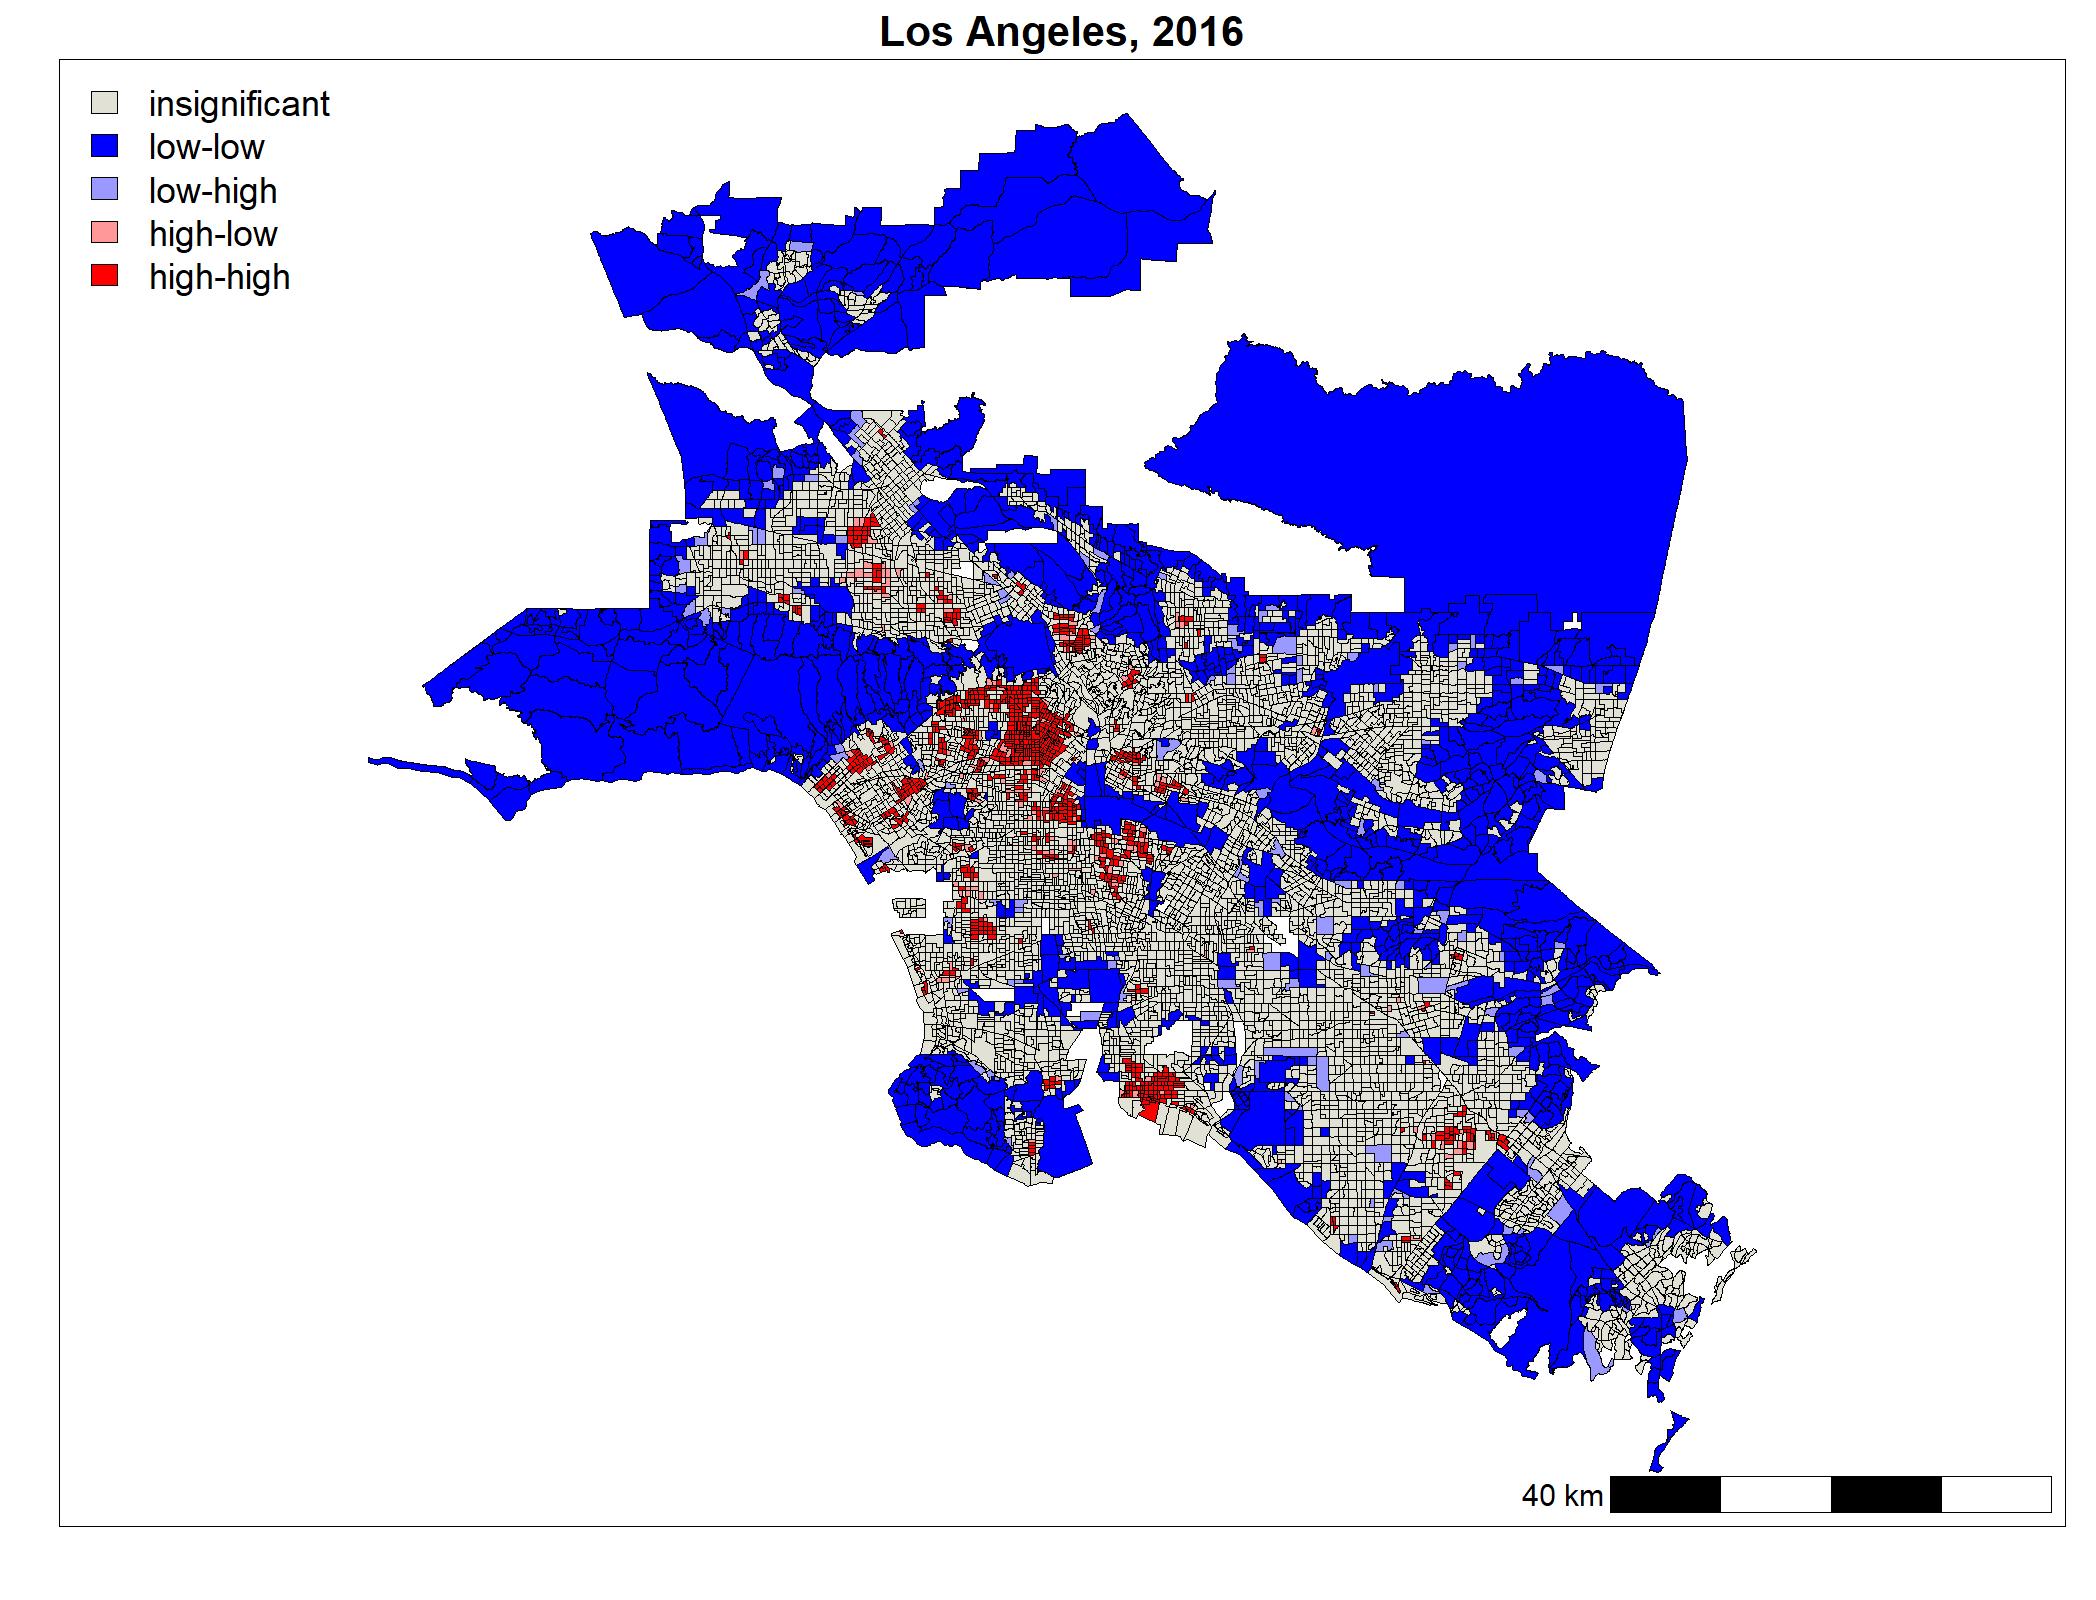
While I can’t share the full project yet, here are some relevant plots. A LISA (Local Indicators of Spatial Association) map using Local Moran’s I. It visualizes block groups in the New York City metropolitan statistical area (defined by the Census as a city and its socially and economically linked surrounding communities). The darkest red indicates high global employment density surrounded by similarly dense neighbors, while pink shows high density surrounded by less dense block groups.
The paper isn’t compete yet, but feel free to check out code for the project on GitHub